Blog›Unreal Memory Insights, LLM, and MemReport Profiling Guide
Unreal Memory Insights, LLM, and MemReport Profiling Guide
Use three complementary views: Low-Level Memory Tracker reports tagged totals over time, MemReport captures a comparable text snapshot of object and resource classes, and Memory Insights traces allocation timelines, callstacks, tags, and live allocations when tracing is configured. Follow the API, failure recovery, and packaged-build validation checklist.
SEELE AI
Posted: 2026-07-26
Visual guide for Unreal Memory Insights, LLM, and MemReport Profiling Guide
Key Takeaways: Unreal Memory Insights, LLM, and MemReport Profiling Guide
Use three complementary views: Low-Level Memory Tracker reports tagged totals over time, MemReport captures a comparable text snapshot of object and resource classes, and Memory Insights traces allocation timelines, callstacks, tags, and live allocations when tracing is configured. Reproduce on the target build, capture a baseline and suspect point with the same content path, diff by owner, then prove that cleanup returns memory to an agreed steady state.
Direct answer
Use three complementary views: Low-Level Memory Tracker reports tagged totals over time, MemReport captures a comparable text snapshot of object and resource classes, and Memory Insights traces allocation timelines, callstacks, tags, and live allocations when tracing is configured. Reproduce on the target build, capture a baseline and suspect point with the same content path, diff by owner, then prove that cleanup returns memory to an agreed steady state.
This is a memory investigation workflow. It does not replace CPU/GPU profiling, asset optimization catalogs, or a guaranteed leak detector on every platform. The practical goal is a game-building slice that another developer can reproduce from a clean checkout. Keep engine behavior, project policy, and measured evidence separate: Epic documentation establishes supported concepts, the project defines ownership and budgets, and only a named test run proves the local result.
What this guide delivers
A concrete ownership model for unreal memory insights llm memreport profiling.
A six-stage Blueprint/C++ implementation workflow with a real API or command example.
Three production scenarios, including normal, edge, and handoff behavior.
Failure recovery and validation criteria for editor and packaged builds.
A bounded SEELE handoff that leads to the Unreal creator without changing this page's technical intent.
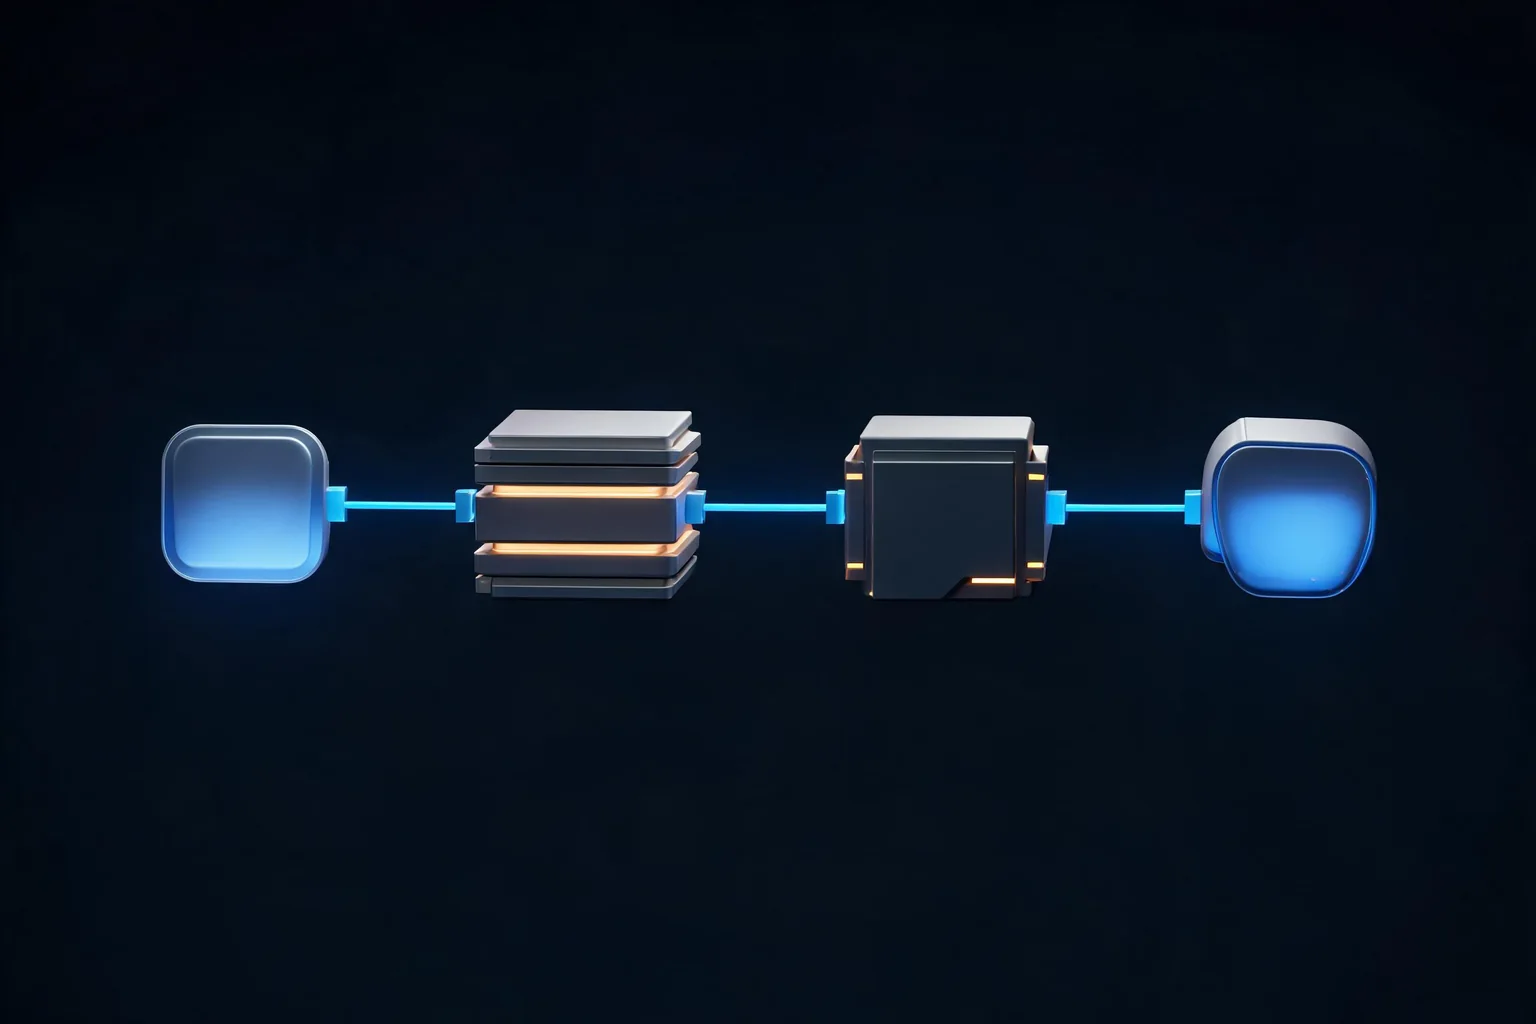
Explain owners and implementation flow for unreal memory insights llm memreport profiling.System architecture and ownership
Budget and baseline
Define platform process budget, Unreal tracked totals, OS working set, loaded map, device profile, build configuration, and stabilization window. A single editor number mixes tooling and game memory and is not a shipping baseline.
Budget and baseline review: capture target process and build identity and show how llm tags receives or observes the accepted result without becoming a second owner.
LLM tags
LLM groups allocations into engine and project tags and can write CSV over time. Add custom tags around owned systems, but remember that tagged totals depend on platform support and instrumentation coverage.
LLM tags review: capture LLM tag totals and peak window and show how memreport snapshots receives or observes the accepted result without becoming a second owner.
MemReport snapshots
Run memreport or memreport -full at repeatable checkpoints, preserve the files, and diff object lists, class counts, textures, render targets, and other sections. Snapshot differences find growth but not necessarily the allocating callstack.
MemReport snapshots review: capture MemReport class and resource deltas and show how memory insights trace receives or observes the accepted result without becoming a second owner.
Memory Insights trace
Launch or connect with memory tracing and callstack options supported by the target, then query allocation lifetime, size, tag, and callstack around the suspect window. Trace overhead and symbol availability are part of the evidence.
Memory Insights trace review: capture allocation lifetime and callstack availability and show how budget and baseline receives or observes the accepted result without becoming a second owner.
Implementation workflow
Stage 1: Choose one target executable, platform, build configuration, map, device profile, and scripted traversal. Disable unrelated editor and background variability.
Stage 2: Record OS process memory and Unreal LLM totals after startup stabilization, then capture a baseline MemReport and trace bookmark before entering the suspect content.
Stage 3: Repeat the exact load, play, travel, or spawn sequence while collecting LLM CSV or trace data and named bookmarks at each phase.
Stage 4: Unload, destroy, travel, or return to menu and wait the documented cleanup window. Capture the recovery MemReport and retained allocation state.
Stage 5: Rank deltas by owning tag, class, asset group, allocation callstack, and count. Distinguish intended caches from unbounded growth by repeating multiple cycles.
Stage 6: Fix one owner, rerun on a clean process, and add a regression threshold tied to the same scenario. Keep trace settings, symbols, commands, and build identity with the result.
Capture baseline in the menu, load and exit the same map five times, compare post-return MemReports, then filter Memory Insights for allocations surviving every cycle.
Evidence for repeated map travel should include target process and build identity, the owning build identity, and the condition that returns this scenario to its last known-good state.
Example 2: Inventory icon growth
An LLM project tag grows when opening the inventory; MemReport shows texture and object count increases; allocation callstacks identify a cache that never evicts after the owning screen closes.
Evidence for inventory icon growth should include LLM tag totals and peak window, the owning build identity, and the condition that returns this scenario to its last known-good state.
Example 3: Streaming peak versus leak
World Partition traversal produces a high peak but returns near the same steady state after cells unload. Treat peak budget and retained growth as separate acceptance criteria.
Evidence for streaming peak versus leak should include MemReport class and resource deltas, the owning build identity, and the condition that returns this scenario to its last known-good state.
Support failure diagnosis and recovery for unreal memory insights llm memreport profiling.Failure modes and recovery
Editor memory is used as shipping proof
Reproduce in the target executable and build configuration. Editor subsystems, previews, and hot reload change both ownership and totals.
Before closing editor memory is used as shipping proof, rerun repeated map travel and prove MemReport class and resource deltas returns to the expected boundary without an undocumented repair step.
Two MemReports are incomparable
Freeze path, timing, build, commands, and stabilization. A diff across different content or garbage-collection points is only a clue.
Before closing two memreports are incomparable, rerun inventory icon growth and prove allocation lifetime and callstack availability returns to the expected boundary without an undocumented repair step.
Memory Insights lacks useful callstacks
Verify launch trace channels, platform support, symbols, and allocator options before the run. Re-capturing is often required; the UI cannot invent missing trace data.
Before closing memory insights lacks useful callstacks, rerun streaming peak versus leak and prove steady-state recovery across repeated cycles returns to the expected boundary without an undocumented repair step.
One cleanup cycle is called a leak
Repeat the scenario, force only documented cleanup when appropriate, and distinguish pools or caches that plateau from allocations that grow every cycle.
Before closing one cleanup cycle is called a leak, rerun repeated map travel and prove target process and build identity returns to the expected boundary without an undocumented repair step.
Validation matrix
target process and build identity: inspect it beside budget and baseline; pass only when editor memory is used as shipping proof does not recur during repeated map travel and the evidence names the exact build.
LLM tag totals and peak window: inspect it beside llm tags; pass only when two memreports are incomparable does not recur during inventory icon growth and the evidence names the exact build.
MemReport class and resource deltas: inspect it beside memreport snapshots; pass only when memory insights lacks useful callstacks does not recur during streaming peak versus leak and the evidence names the exact build.
allocation lifetime and callstack availability: inspect it beside memory insights trace; pass only when one cleanup cycle is called a leak does not recur during repeated map travel and the evidence names the exact build.
steady-state recovery across repeated cycles: inspect it beside budget and baseline; pass only when editor memory is used as shipping proof does not recur during inventory icon growth and the evidence names the exact build.
Version and source boundaries
These steps target the current Unreal Engine 5 documentation surface as of 2026-07-26. Engine defaults, experimental status, plugin packaging, API signatures, and platform support can change. Select the documentation version that matches the project, test the exact patch and target, and retain a rollback revision. Public documentation does not replace NDA platform requirements, store review, console certification, or project-specific performance evidence.
Official sources
Memory Insights — source evidence for budget and baseline in this unreal memory insights llm memreport profiling workflow; verify the documentation version against the shipping branch.
Low-Level Memory Tracker — source evidence for llm tags in this unreal memory insights llm memreport profiling workflow; verify the documentation version against the shipping branch.
MemReport — source evidence for memreport snapshots in this unreal memory insights llm memreport profiling workflow; verify the documentation version against the shipping branch.
Unreal Engine is a trademark of Epic Games. SEELE AI is independent and this article does not imply Epic Games or Valve endorsement.
From the technical plan to a SEELE Unreal game
Use this page to define the system, acceptance tests, and failure boundaries; then carry that precise brief into [SEELE's Unreal game creator](/features/create/unreal-game). SEELE can generate a native Unreal 5 game, provide an in-browser preview, support optimization and packaging in SEELE, and let you download the project or packaged output for external publishing or publish it as a free or paid SEELE game.
That handoff does not change the native production responsibility described above. Store approval, sales, revenue, certification, third-party plugin compatibility, and platform compliance are not guaranteed. Keep the source Unreal game, build logs, test evidence, and external publishing decisions under your team's control.
FAQ
What is the correct architecture for unreal memory insights llm memreport profiling?
Use three complementary views: Low-Level Memory Tracker reports tagged totals over time, MemReport captures a comparable text snapshot of object and resource classes, and Memory Insights traces allocation timelines, callstacks, tags, and live allocations when tracing is configured. Reproduce on the target build, capture a baseline and suspect point with the same content path, diff by owner, then prove that cleanup returns memory to an agreed steady state. Start with budget and baseline and llm tags, then keep presentation as an observer of committed gameplay state.
Should unreal memory insights llm memreport profiling be built in Blueprint or C++?
Either can work. Blueprint is effective for rapid game logic and designer iteration; C++ is useful for reusable contracts, complex lifetime, performance-sensitive loops, and automated tests. Preserve the same owner, validation, failure, and recovery boundaries in both.
How should unreal memory insights llm memreport profiling be tested?
Test one normal case, one invalid input, interruption or teardown, clean restart, and packaged-build parity. Capture target process and build identity, LLM tag totals and peak window, MemReport class and resource deltas with a build identifier and explicit pass criteria.
What is the most dangerous failure in unreal memory insights llm memreport profiling?
Editor memory is used as shipping proof is an early warning: Reproduce in the target executable and build configuration. Editor subsystems, previews, and hot reload change both ownership and totals. Also verify cleanup and retry so the apparent fix does not leave stale state.
Which Unreal version does this unreal memory insights llm memreport profiling guide target?
It uses the Unreal Engine 5 documentation surface available on 2026-07-26. Confirm the version selector, API signature, plugin status, platform toolchain, and packaged behavior in the exact engine patch that will ship.
What can SEELE do after this unreal memory insights llm memreport profiling plan is ready?
SEELE can generate a native Unreal 5 game, provide browser preview, support optimization and packaging, and provide project or packaged downloads for external publishing or a free or paid SEELE release. It does not guarantee third-party store approval, compatibility, sales, or revenue.
Was this guide helpful? Use it as a starting point, then continue the best direction in Seele AI.